Trade Journal — close a sim trade and it auto-logs, with the math already done
// auto-logged from the sim · r-multiple · tape score · playbooks · calendar heatmap · 11 reports · share links · csv import (pro)
A free trade journal wired straight into the paper-trading simulator: close a trade and it bridges into the journal automatically, with its R-multiple, side, size, P&L, and tags already attached. No CSV. No manual entry. Then grade your record with a 0–100 Tape Score, hold yourself to rule-defined Playbooks, drill into a month from the calendar heatmap, and read your own notes the next time you take the same setup.
§01 // WHAT_IT_DOES
What it does
Every trade you close in Tapeboard’s free paper-trading simulator writes itself to the journal — entry, exit, side, size, R-multiple, P&L, duration, and any setup tags you attached. There is no import step and no “did I log that one?”: the trade lands in the journal the moment you close it. That is the practice-to-review loop in a single app. Trades you took elsewhere come in via CSV import on Pro.
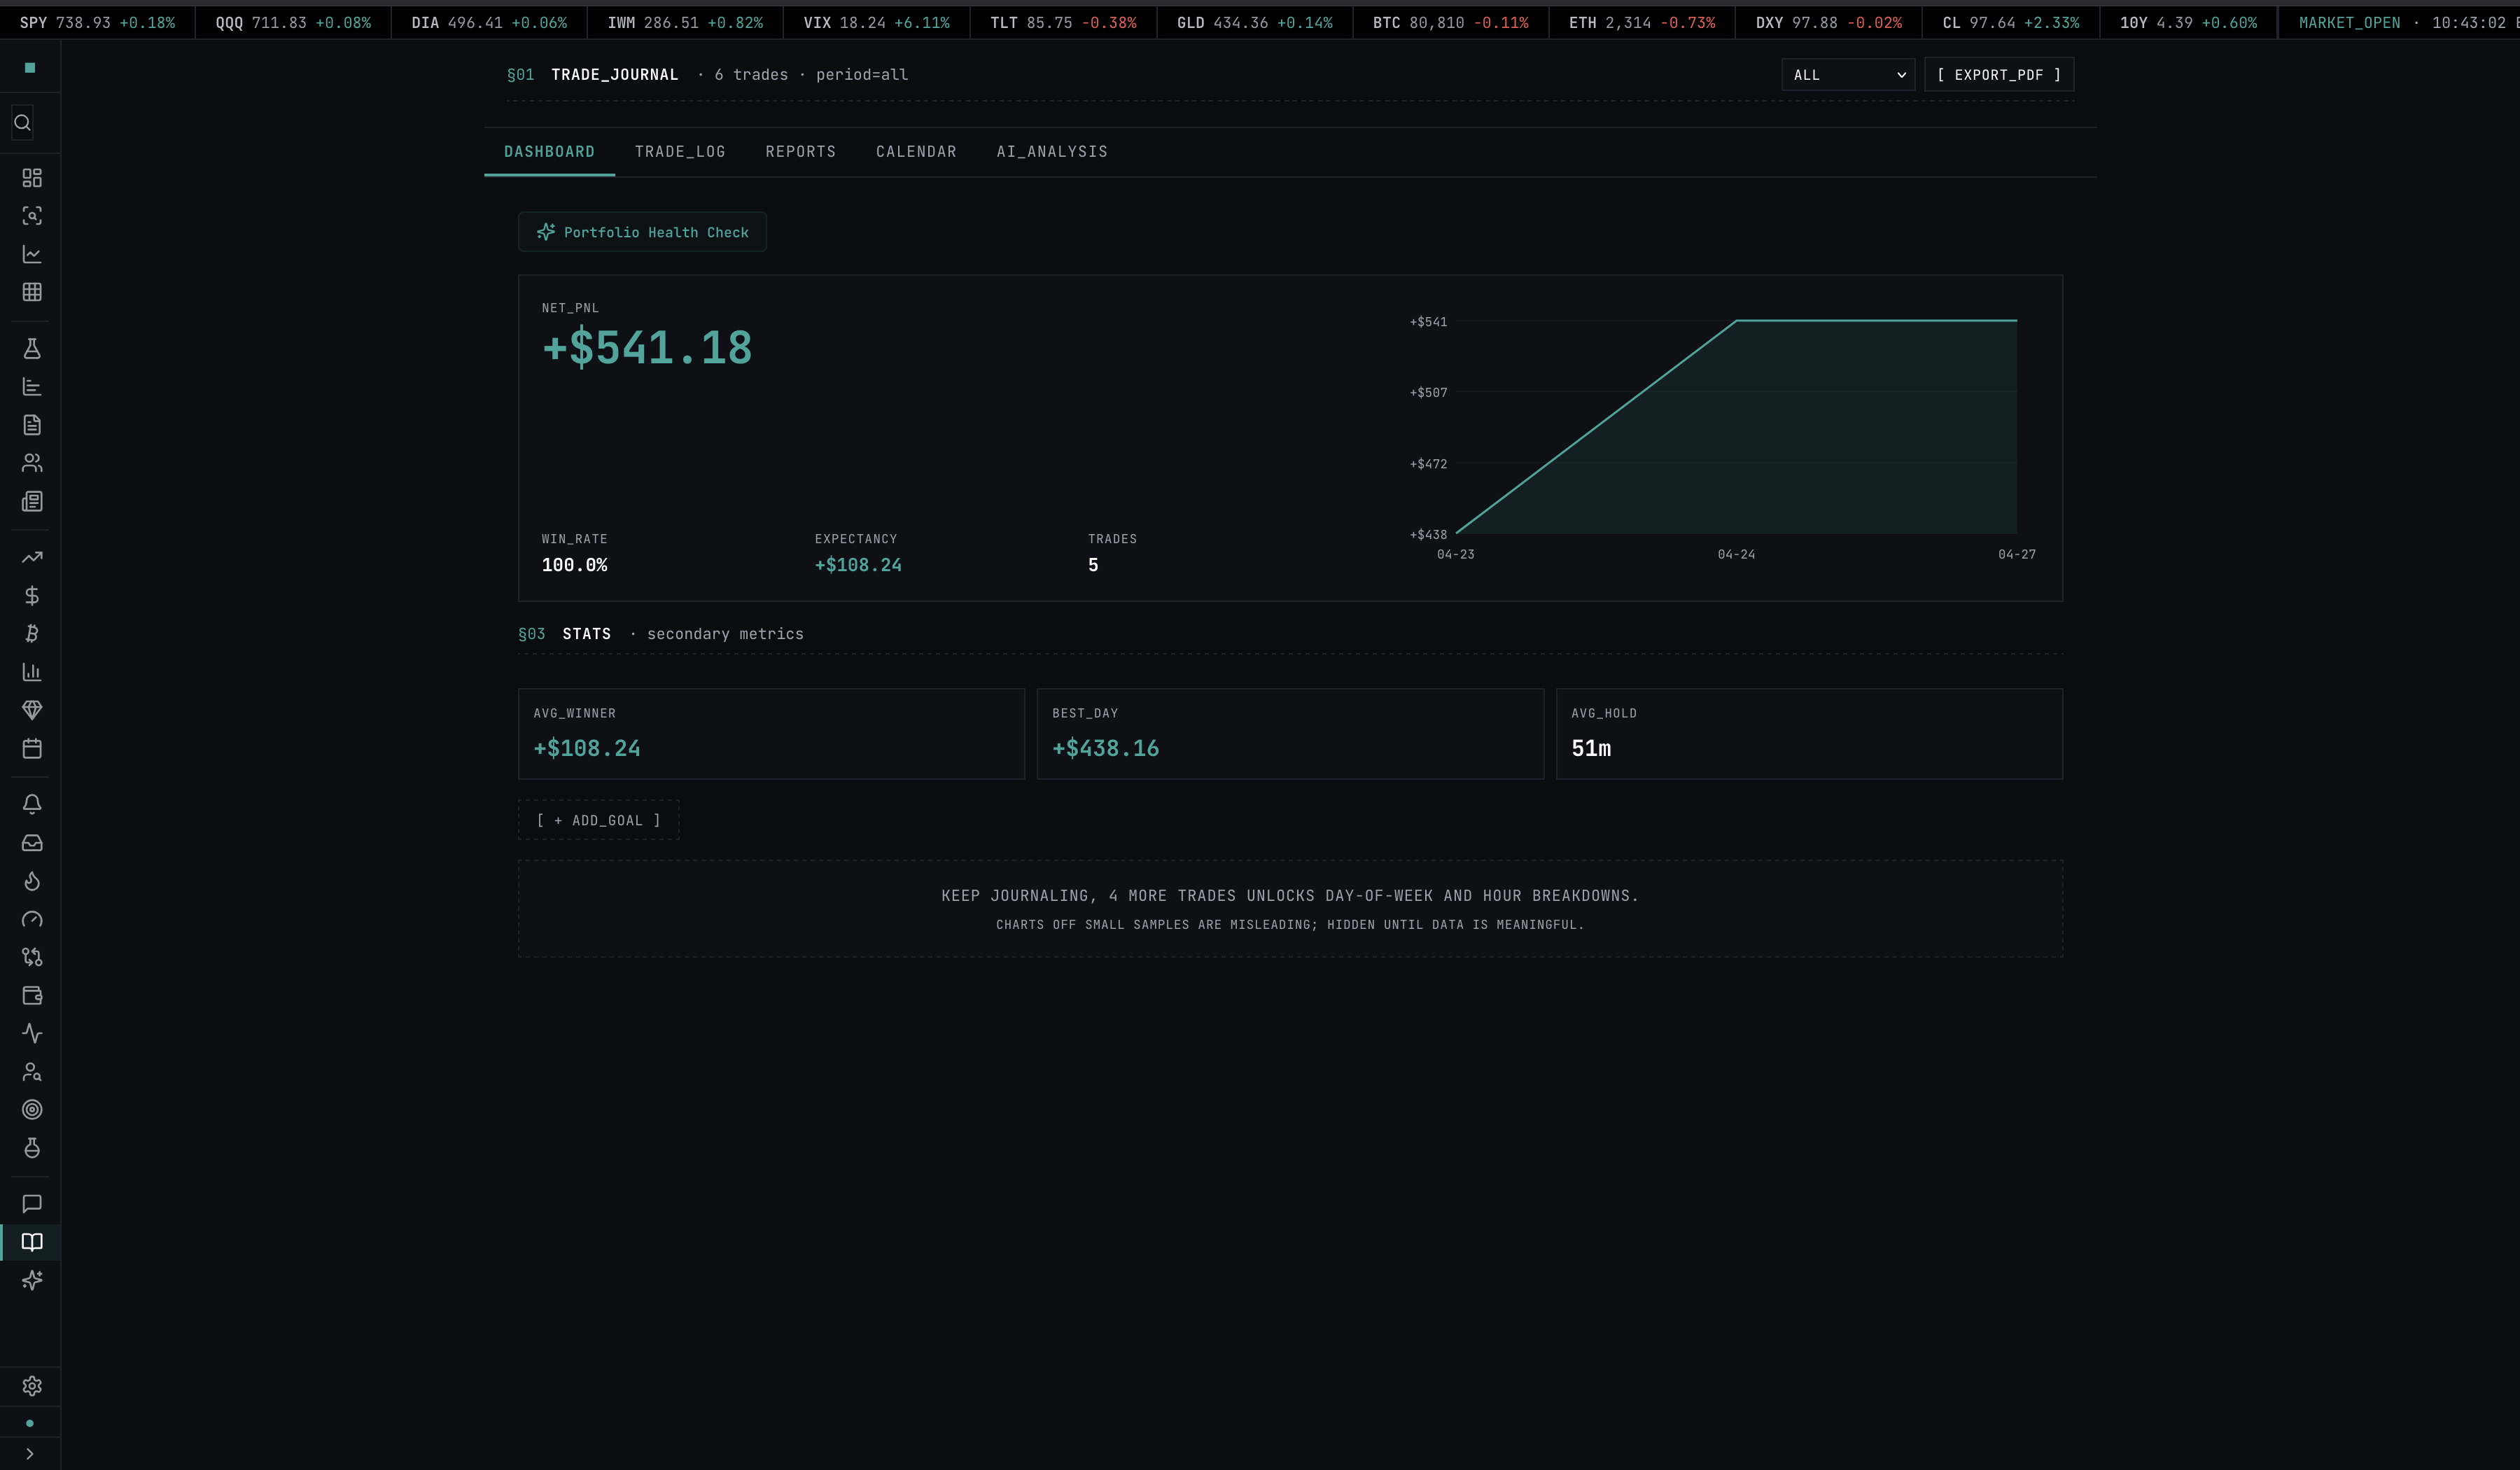
Once the data is structured, the leaks find themselves. Filter by setup tag, grade the whole record with a 0–100 Tape Score, check each trade against rule-defined Playbooks, drill into a month from the calendar heatmap, and read your own markdown notes from the trade you’re about to take a second time.
§02 // HOW_IT_WORKS
How it works
- Trade the free simulator. Place orders with realistic spread, slippage, and commission fills in the paper-trading simulator — live or in market replay.
- Close a trade — it auto-bridges. On close, the fill is written to the journal with its R-multiple, side, size, P&L, duration, and tags. No import, no copy-paste.
- Tag and annotate. Add a setup tag and markdown notes, or attach the trade to a Playbook so adherence is checked automatically.
- Review the record. Open the analytics tab for win rate, profit factor, expectancy, R-distribution, drawdown, the calendar heatmap, and the 11 reports — and read your Tape Score grade.
- Share a single trade, safely. Generate a privacy-safe share link for any one trade without exposing the rest of your account.
§04 // FIELDS
The fields we track
Entry / Exit
Timestamped to the second on the fill, with side (long or short), quantity, average fill price, and hold duration. Same shape whether the trade auto-bridged from the paper-trading simulator or arrived via CSV import on Pro.
R-Multiple
R-multiple is computed per trade as (exit − entry) ÷ (entry − stop), with stop pulled from the bracket order if attached, or manually set. R-multiples normalize trades across position sizes so the journal can rank setup quality independent of how much you risked. Full derivation: the R-multiple methodology.
Setup Tags
Unlimited free-form tags per trade — “opening drive,” “gap fill,” “VWAP reclaim,” “news fade.” Tags drive the analytics tab: setup-filtered analytics segment win rate, average R, and expectancy by user-defined setup tag.
Notes
Per-trade markdown editor with paste support. Drop a screenshot, type your thesis, log what went right or wrong. Retrievable from the trade row or via tag filter on the analytics tab.
§05 // TAPE_SCORE
Tape Score — a 0–100 grade for your record
Once you have at least 10 closed trades, the journal grades your record with a single 0–100 Tape Score and an A–F letter. It blends five risk-normalized components — profit factor, R-expectancy, win rate, consistency (the share of trading days that closed green), and drawdown control — so the grade is account-size agnostic: a $1,000 account and a $1,000,000 account with the same edge earn the same grade.
The headline number and letter are free. Pro unlocks the per-component driver breakdown — the raw value and sub-score behind each factor — so you can see exactly which input is pulling the grade up or down. The exact weights, normalization formulas, and what the score does not claim are published at /methodology/tape-score.
§06 // PLAYBOOKS
Playbooks — rule-defined setups, adherence checked for you
A Playbook is a setup written as rules: define the entry trigger, the stop, and the target for, say, a VWAP reclaim or a gap-and-go, and the journal checks each tagged trade against those rules for machine-checkable adherence. You then get per-Playbook performance — win rate, average R, and expectancy for that named setup — so you can answer two questions at once: is the setup itself profitable, and am I actually following my own rules when I take it. Playbooks are a Pro feature.
§07 // CALENDAR
Calendar view
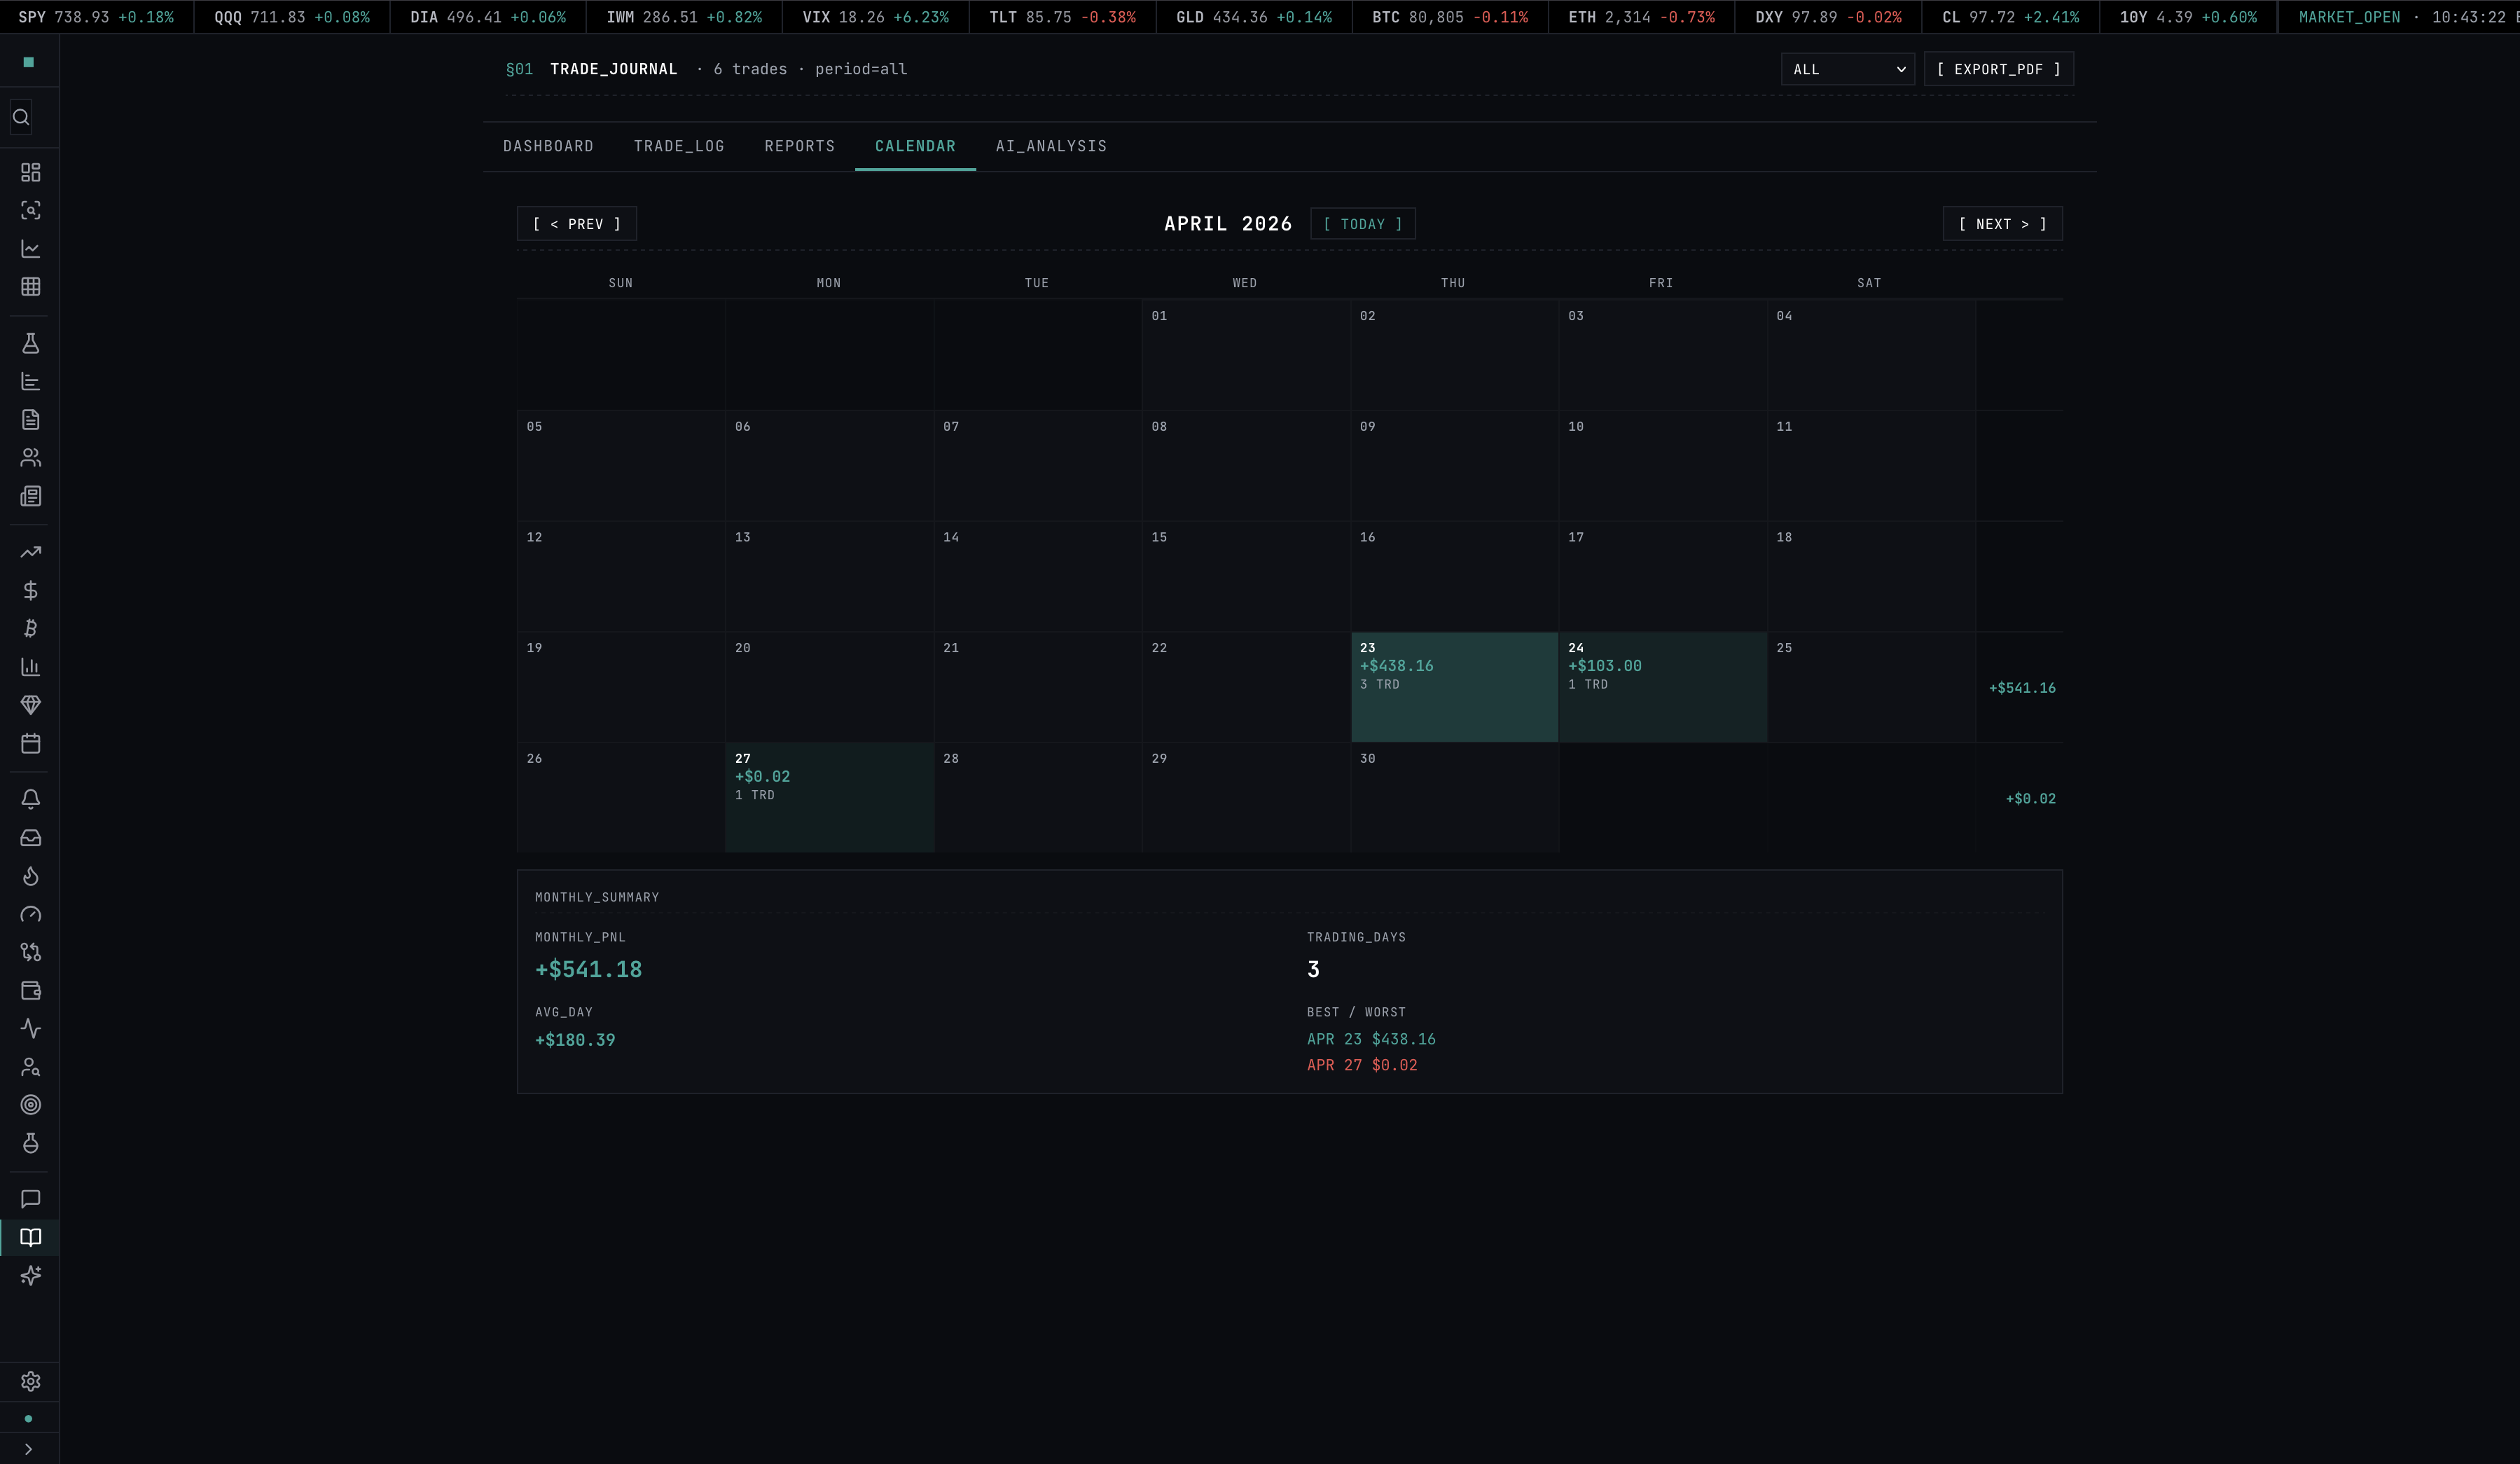
Month-grid P&L heatmap. Each cell is a day, color-scaled by net P&L — green up, red down, neutral on flat. Click any day to drill into the trades that hit that day, with R-multiples and tags inline. Quick way to see whether a losing week was one bad day or five mediocre ones.
§08 // ANALYTICS
Analytics tab — 11 reports
The core metrics — win rate, profit factor, expectancy, R-multiple, max drawdown, and an equity curve — sit on top of 11 reports that slice the record every way that matters for setup-level improvement:
- Win rate, average R, and expectancy by setup tag and by Playbook
- R-distribution histogram across all closed trades
- Equity curve and max-drawdown over the account’s history
- Mistake Cost — the dollar and R impact of breaking your own rules
- MFE / MAE — maximum favorable and adverse excursion per trade and per setup
- Time-of-day curves (which hour you actually make money in)
§09 // NOTES
Markdown notes + share links
Per-trade markdown editor with paste support for chart screenshots inline. Notes are retrievable via tag filter — click a setup tag in the analytics tab and the notes for every trade in that bucket render in a single scrollable column. Useful for spotting the difference between the version of the setup that works and the version that does not.
Want to share a trade without opening your whole account? Every trade has a privacy-safe share link (tapeboard.com/s/:id) that renders just that one trade — entry, exit, R-multiple, and chart — as a standalone, OG-previewed page. It shows the trade you chose and nothing else about your balance or other positions.
§10 // COMPARISON
Tapeboard vs Tradervue vs TraderSync vs Edgewonk
| Tapeboard | Tradervue | TraderSync | Edgewonk | |
|---|---|---|---|---|
| Free tier | Yes (journal + Tape Score) | Yes, 100 trades/mo | 7-day trial only | No, 14-day trial |
| Paid price | $39/mo ($290/yr) | $29.95/mo | $29.95/mo | $169/yr (~$14/mo) |
| Auto-log from built-in sim | Yes, native | N/A | N/A | N/A |
| Broker auto-import | Roadmap (2026) | 100+ brokers | 70+ brokers | CSV + 25 brokers |
| CSV import of outside trades | Yes (Pro) | Yes | Yes | Yes |
| R-multiple analytics | Yes | Yes (Silver+) | Yes | Yes |
| Performance grade (0–100) | Yes (Tape Score) | No | No | No |
| Rule-checked Playbooks | Yes (Pro) | No | Partial | No |
| Calendar heatmap | Yes | Yes | Yes | No |
| Setup tagging | Unlimited | Yes | Yes | Yes |
| Markdown notes | Yes | Plain text | Rich text | Rich text |
| CSV export | Yes | Yes | Yes | Yes |
| Live market data on same screen | Yes | No | No | No |
// Tradervue and TraderSync have deeper live-broker integrations today — if you’re trading live across multiple brokers and need every fill imported now, they’re more mature. Tapeboard wins if you practice in the built-in simulator (trades auto-log, no import) or want journal + Tape Score + terminal in one window.
Head-to-head breakdowns: vs Tradervue · vs Tradezella · vs TraderSync · vs Edgewonk · vs Chartlog.
§11 // PRICING
Pricing & access
Free — the journal, auto-logging from the simulator, calendar heatmap, the core analytics (win rate, profit factor, expectancy, R-multiple, drawdown, equity curve), the 0–100 Tape Score grade, and setup tagging. No credit card.
Pro — $39/mo (or $290/yr, about $24/mo) — journal AI, CSV import of outside trades, Playbooks, and the per-component Tape Score driver breakdown. CSV export carries one row per fill, compatible with most journal and tax workflows.
Terminal — $79/mo — the full terminal tier, including true Level 2 walk-book fills in the simulator and live L2 depth.
§12 // RELATED
Related pages
§13 // FAQ
Trade journal FAQ
Is Tapeboard’s trade journal free?
Yes. The free tier includes the journal, calendar heatmap, the core analytics (win rate, profit factor, expectancy, R-multiple, max drawdown, equity curve), your 0–100 Tape Score grade, and setup tagging. Pro ($39/mo, or $290/yr) adds journal AI, CSV import, Playbooks, and the per-component Tape Score driver breakdown. Terminal ($79/mo) is the full terminal tier. No credit card required to start.
How do trades get into the journal — do I import them?
If you trade in Tapeboard’s free paper-trading simulator, you do not import anything: closing a sim trade auto-bridges it straight into the journal with its R-multiple, side, size, P&L, and any setup tags already attached. That is the whole practice-to-review loop in one app. For trades you took elsewhere, Pro adds CSV import. Direct broker auto-import is on the 2026 roadmap; until then, outside trades come in via CSV.
What is an R-multiple in trading?
An R-multiple is your profit or loss expressed as a multiple of your initial risk. If you risked $100 and made $300, that’s a +3R trade. R-multiples normalize trades across position sizes so you can measure setup quality independent of size, which is why every serious journal tracks it. The full formula and worked examples are documented at tapeboard.com/methodology/r-multiple.
What is the Tape Score?
The Tape Score is a single 0–100 grade (with an A–F letter) summarizing the quality of your closed-trade record. It blends profit factor, R-expectancy, win rate, consistency, and drawdown control — every component is risk-normalized, so the grade is account-size agnostic. The headline number and letter are free; Pro unlocks the per-component driver breakdown so you can see exactly which factor is pulling the grade up or down. The full methodology is published at tapeboard.com/methodology/tape-score.
What are Playbooks?
A Playbook is a rule-defined setup — you write the entry, stop, and target rules for, say, a VWAP reclaim or a gap-and-go — and the journal checks each tagged trade against those rules for machine-checkable adherence. You then see per-Playbook performance (win rate, average R, expectancy) so you can tell which of your setups actually pay and whether you’re following your own rules. Playbooks are a Pro feature.
Can I share a trade without exposing my account?
Yes. Every trade has a privacy-safe share link (tapeboard.com/s/:id) that renders the trade — entry, exit, R-multiple, and chart — as a standalone, OG-previewed page. It shows the single trade you chose to share and nothing else about your account, balance, or other positions.
What reports and analytics do I get?
The analytics layer covers win rate, profit factor, expectancy, R-multiple, max drawdown, equity curve, a calendar P&L heatmap, and 11 reports including Mistake Cost and MFE/MAE (maximum favorable and adverse excursion). Stats can be sliced by setup tag and by Playbook so you can rank which setups have positive expectancy.
Can I export my trade journal for taxes?
Yes. CSV export includes entry/exit timestamps, side, quantity, price, P&L, and fees, with one row per fill. The export is compatible with most CPA and tax-software workflows. Tapeboard does not generate Form 8949 directly — that’s your accountant’s or tax software’s job.
Stop using a spreadsheet.
Free tier, no credit card. Close a paper trade and it auto-logs the second it executes — then grade it with your Tape Score.
Start free View pricing